Power BI Tips: How To Increase The Number of Rows Exported to Excel
The Issue with Power BI Export Limits
Currently, Power BI has an export limit of 30,000 rows when you export to CSV, and 150,000 when you export to Excel.
There are numerous complaints of this limit. In many cases the limit is a deal breaker when companies decide which reporting tool to use. Ideally, the limit would be configured by Power BI administrators.
The good news is that there’s a way to overcome this limit, but it requires a little development effort.
Tips To Help Your Power BI Export To Excel
First, you must have Power BI Premium, because you’ll need to use Power BI embedded. At this time Microsoft only allows a connection to the Power BI dataset published on a Premium node (However, they have promised to change this in the future).
Here are the steps:
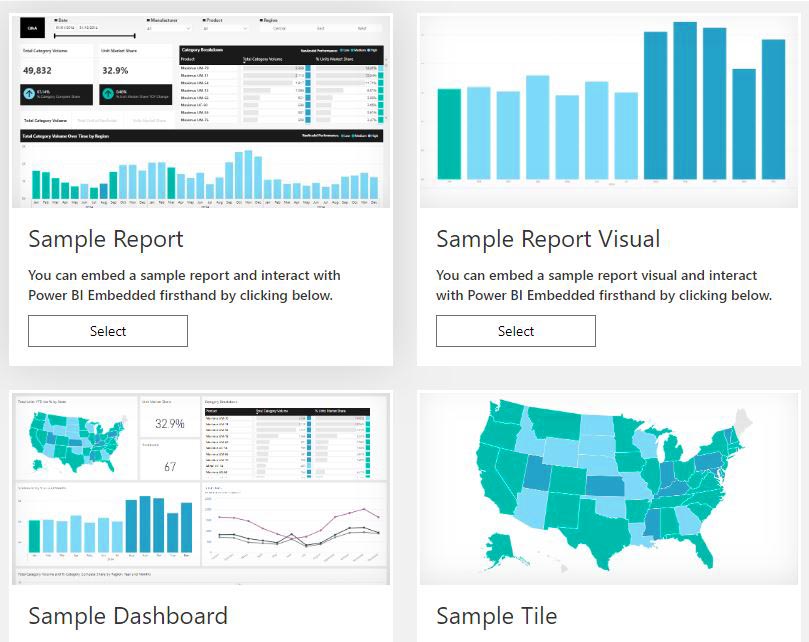
- Embed your report in a web app using Power BI embedded. Here’s the ‘Power BI Embedded Playground’ with examples of the API calls.
- Using the Power BI JavaScript API, collect the state of all the slicers in your web app, in the sample web site (above) it is called “Get slicer state”, you can get the JavaScript code from there. Below is the sample JavaScript code from the above tool.
- Using SQLBI’s DAX Studio, capture the DAX query which Power BI sends to the dataset to get the export, you can capture it either connecting to the Power BI desktop or the Power BI dataset published on the server.
- The DAX query generated in the previous step (please see the example at the end of this post) contains three main parts:
DEFINE This part of the query defines your filters. You will need to change it in order to dynamically define the filters based on your slicer states collected during step #2. The good news is that each variable defined in this part will match one of your slicers, so creating the DAX expression based on the slicers states is not very difficult.
EVALUATE TOPN(30002) This is the part where Microsoft hardcoded the number of exported rows. TOP 30002 means that the query will return only first 30002 of the result (1 row of the header + 30001 rows of result). Now you can change it to any number you want (I changed it to 300,000).
ORDER BY You can remove this from the query. If you export it to Excel the users can re-order the data the way they want anyhow.
5. From your web application you will connect to the Power BI dataset. Here are a few resources which will help:
- Connecting to Azure Analysis Services using Service principal or User token
- Using the Power BI Rest API’s as a data source in Power BI
Here’s the NuGet package for .Net 4.6 I used : Microsoft.AnalysisServices.AdomdClient.retail.amd64 version 16.3.0.
You can use the similar component from .Net Core if you need to run it on Linux or Mac.
6. Execute the DAX with dynamically generated filters created in step #4 against the Power BI dataset using the connection created in step #5. I used command.ExecuteReader().
Here’s an example of the DAX query generated by Power BI when exporting to CSV:
DEFINE
VAR __DS0FilterTable =
TREATAS(
{“Canada”,
“France”,
“Germany”,
“United Kingdom”,
“United States”,
“Australia”},
‘DimGeography'[EnglishCountryRegionName] )
VAR __DS0FilterTable2 =
TREATAS(
{“Canada”,
“United States”,
“Australia”},
‘DimSalesTerritory'[SalesTerritoryCountry] )
VAR __DS0FilterTable3 =
TREATAS({“Bikes”,
“Accessories”}, ‘DimProductCategory'[EnglishProductCategoryName])
VAR __DS0FilterTable4 =
TREATAS({2011,
2012,
2013}, ‘DimDate'[CalendarYear])
VAR __DS0FilterTable5 =
TREATAS({“January”,
“February”}, ‘DimDate'[EnglishMonthName])
EVALUATE
TOPN(
30002,
SUMMARIZECOLUMNS(
ROLLUPADDISSUBTOTAL(
ROLLUPGROUP(
‘FactResellerSales'[DueDate],
‘DimProduct'[EnglishProductName],
‘DimEmployee'[DepartmentName],
‘DimSalesTerritory'[SalesTerritoryCountry],
‘FactResellerSales'[ShipDate] ), “IsGrandTotalRowTotal”
),
__DS0FilterTable,
__DS0FilterTable2,
__DS0FilterTable3,
__DS0FilterTable4,
__DS0FilterTable5,
“SumSalesAmount”, CALCULATE(SUM(‘FactResellerSales'[SalesAmount])),
“SumDiscountAmount”, CALCULATE(SUM(‘FactResellerSales'[DiscountAmount])),
“SumOrderQuantity”, CALCULATE(SUM(‘FactResellerSales'[OrderQuantity])),
“Total_Sales”, ‘FactResellerSales'[Total Sales],
“SumUnitPrice”, CALCULATE(SUM(‘FactResellerSales'[UnitPrice]))
),
[IsGrandTotalRowTotal],
0,
[SumSalesAmount],
0,
‘FactResellerSales'[DueDate],
1,
‘DimProduct'[EnglishProductName],
1,
‘DimEmployee'[DepartmentName],
1,
‘DimSalesTerritory'[SalesTerritoryCountry],
1,
‘FactResellerSales'[ShipDate],
1
)
ORDER BY
[IsGrandTotalRowTotal] DESC,
[SumSalesAmount] DESC,
‘FactResellerSales'[DueDate],
‘DimProduct'[EnglishProductName],
‘DimEmployee'[DepartmentName],
‘DimSalesTerritory'[SalesTerritoryCountry],
‘FactResellerSales'[ShipDate]
That’s it! We hope this blog helped you to increase the number of Power BI rows exported.
Stay in touch with more tips on improving your Power BI reports and learn more about our suite of Power BI services or contact us to schedule a free consultation.
Vlad Gedgafov is a Senior BI Consultant at DesignMind.
