How To Standardize Reports with Power BI Themes and Templates
Power BI Themes and Templates Can Ramp Up Your Data Analysis

Power BI is a powerhouse product that allows you to explore and truly understand your data. It’s not just an analytical tool, but displays your results in a clear and compelling manner.
Data analysis often provides clear insights. This is exactly why there is such an incredible industry focus on creating stunning visualizations. And by using Power BI themes and templates, you can easily take your data analysis to a higher level.
Using Themes to Standardize Your Reports
Vincent Van Gogh said “Color in a painting is like enthusiasm in life”.
As a manager or leader, you live and breathe the excitement that comes with your business. The visual elements of Power BI help you to powerfully convey key insights into your data to others.
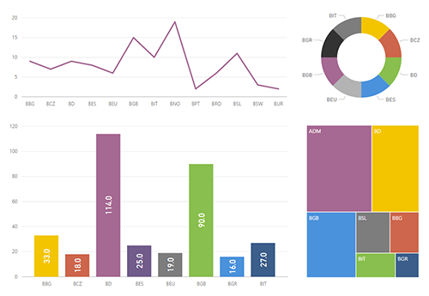
Power BI has the ability to utilize design “themes” which are a JSON defined color palette (JSON is a minimal and readable format for storing data files) to help you standardize the look and feel of your reports. You can appeal to the aesthetics of a client, showcase your company’s style guidelines, or use different hues for seasonal reports. When you apply a Report Theme, all visuals in your report use the colors from your theme. Report themes are now available in Power BI Desktop and are also carried with your report whenever you publish it.
Depending on the version of Power BI Desktop, themes may still be in preview mode. To enable themes in preview mode, check the box for “Custom Report Themes” in the Preview Features section of the Settings and then restart your Power BI Desktop. You can see examples of report themes in the Power BI Themes Gallery, which also has samples available for download.
How to Share Your Power BI Themes
You will want to establish your report themes in the early stages of a project, ensure they are accessible in a shared location, and abide by your company’s style guides to assist future report authors.
The simplest way to share this information is to use a OneDrive location, like the one linked to a Power BI Service workspace. Learn more about Power BI File Management with OneDrive.
Go one step further by creating a Power BI Template
Another useful way to standardize your Power BI reports is to utilize a template. Templates indicate which data will be drawn into the report, along with the color scheme coming from the theme. You can create a template using an existing report and later instantiate it as a full report. To create a Power BI Template; go to File, Export, then Power BI Template. Then name your template and choose the desired location.
Your new template will include the report definition, the data model, as well as the and queries. After you’re finished, the template will include everything in the original Power BI report except the data itself, which can then and can be utilized by a future author, saving your team time and reducing the risk of errors.
Get started with a Template now
You can also use report templates as starter reports, with or without existing queries. Save your company logo in the top left corner, place holders for page titles on the canvas, then use snap to grid alignment on the canvas (found in the View tab). Save your template to a shared location and share your standardized report template with your team.
Power BI themes and templates are an immediate way to add another layer of professionalism and efficiency to your organization.
To learn more about Power BI, see what our team is writing about Power BI and Data Visualization. To get started, join us in San Francisco or Irvine for one of our Power BI Dashboard In A Day training workshops.
Eric Bragas is a Business Intelligence Consultant at DesignMind.